Direct3D is a large API that reflects the complex nature of 3D graphics rendering and the complexities of modern video cards. As one of my peers puts it:
The hard part about computer graphics is that there are too many ways to draw a black screen. — Russ Fish
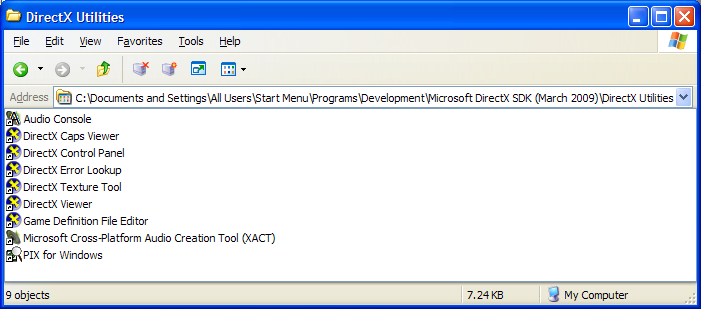
The DirectX SDK ships with a set of tools to help you deal with common programming errors. The most important of these tools is the debug runtime. Microsoft uses the term “Runtime” to refer to the DLLs that supply an application programming interface (API). The DirectX SDK installs two versions of the Direct3D runtime: a release version for end users and a debug version for developers. The SDK includes a DirectX Control Panel utility that allows you to switch between the debug and release runtimes. It is in the Start Menu program group created by the SDK under DirectX Utilities.
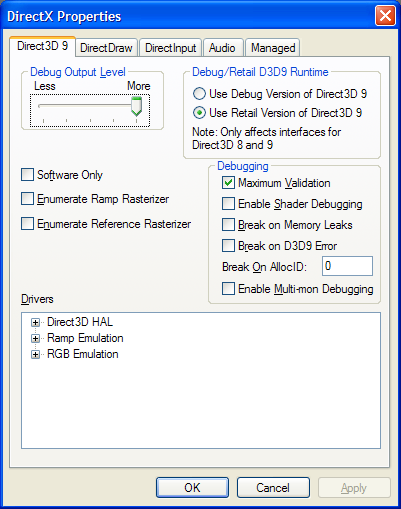
When you run the DirectX Control Panel utility, you can select the debug vs. retail setting on the Direct3D9 tab:
The main difference between the retail and debug runtimes is that the debug runtime performs additional validation on the input parameters coming from your code. When invalid combinations are detected, a failed HRESULT is returned by the called function and a diagnostic message is printed to the debug output stream. When running a native executable in the debugger under Visual Studio, the debug output stream appears in the Output window. Be sure to select Debug from the combobox. You can also use a tool like DebugView to view the debug output stream independently of a debugger or Visual Studio.
When a Direct3D interface method fails with invalid parameters, the returned error code is usually D3DERR_INVALIDCALL no matter what the reason for the invalid parameters. With the debug runtime, a message is always printed to the debug output stream indicating the underlying problem. These messages will include the word ‘error’ in them. You may see other messages that are informational in nature or are warnings. You may wish to review the source of warnings as these could be potential errors. Informational messages are just that — informational. They are safe to ignore.
Using the control panel utility, you can configure the runtime to break into the debugger immediately upon returning a failed HRESULT. This may not be as useful as you might think as the first thing a Direct3D application might do is to check device and format support, calls which typically result in expected failures and are not sources of error.
The debug runtime also has features to help you isolate leaked interface references. When using the debug runtime and the device is released, it reports out any associated interfaces that have not yet been freed. Each of these potential resource leaks is reported with an allocation ID. As long as your code executes the same path consistently, then the allocation ID for the leaked resource will be consistent from run to run. You can use the allocation ID in the control panel utility to force a break into the debugger when that allocation ID is reached to identify the resource that is leaked at the time of its allocation.
One additional feature of the debug runtime is that the back buffers are filled with a bright color before being used by your application. If you see bright flashing colors (pink and green, typically) when your application is running under the debug runtime, it indicates that you have not rendered into the entire back bufer when you specified a discard swap effect. Usually this indicates that you forgot to call Clear on the device before rendering.


29-June-2009 at 11:42 am
To be honest to finding on released resource is easier done by using PIX for windows. When you capture a stream and put the selection on the last frame it will tell you which resource are still alive, none should be alive when you select application end.
Generally I found that the warnings and Infos in day to day debugging aren’t that usefull. Most of the time I run my debug runtime on one level below max, and only run max when i am doing performance/final testing.
LikeLike
29-June-2009 at 10:44 pm
As pointed out to me on the Direct3D newsgroup, there are different ways of using the debug runtime information in Direct3D10 and Direct3D11. Once I have more experience with using these myself, I will update this blog post to contain that information. Until then, please consult the DirectX SDK documentation if you are using D3D10 or D3D11.
LikeLike
5-July-2009 at 10:56 pm
[…] #6: Link Against The Debug D3DX 5-July-2009 — legalize Just as important as using the Direct3D debug runtime is using the debug D3DX library. D3DX is provided as a DLL library and like the runtime it is […]
LikeLike
13-January-2022 at 1:25 pm
[…] Or if you have it installed, it is not turned on. You might find some useful information how to switch between Debug and Release version of Direct X Runtime. […]
LikeLike